Open account
Open accountLog In
Open account

Oct 30, 2025

Strategy

How to Trade on Tweezer Top and Tweezer Bottom Candlestick Patterns

In this article

Tweezer Top and Tweezer Bottom Candlestick

Traders have many tools at their disposal to help them make better informed trading decisions. The use of candlesticks is very common to try to predict short-term price movements. Candlestick charts are visual price indicators that resemble candlesticks. They show how the price of an asset moves during a specific time period, and are green when the price movement is bullish and red when it is bearish. They form patterns that traders can use to spot trends and reversals, so they are widely used in technical analysis (TA).

Tweezer patterns are some of the simpler candlestick signals out there, and you don’t need any fancy tools to spot them. They're not guarantees and they don’t predict the market perfectly, but they can give you an early heads-up that something’s changing. Let’s walk through what Tweezer patterns are, how to recognize them, and how you might trade on them.

What are Tweezer candlestick patterns?

Tweezer patterns are a type of candlestick chart pattern used in technical analysis and considered a signal of a reversal, as they signify that the market is having a hard time moving past a certain price level. The pattern is formed when two consecutive candlesticks have very similar highs or lows.

They get their name from the resemblance the two side-by-side candles that form the pattern have to tweezers. Steve Nison made them popular after he wrote about them in his book, Japanese Candlestick Charting Techniques.

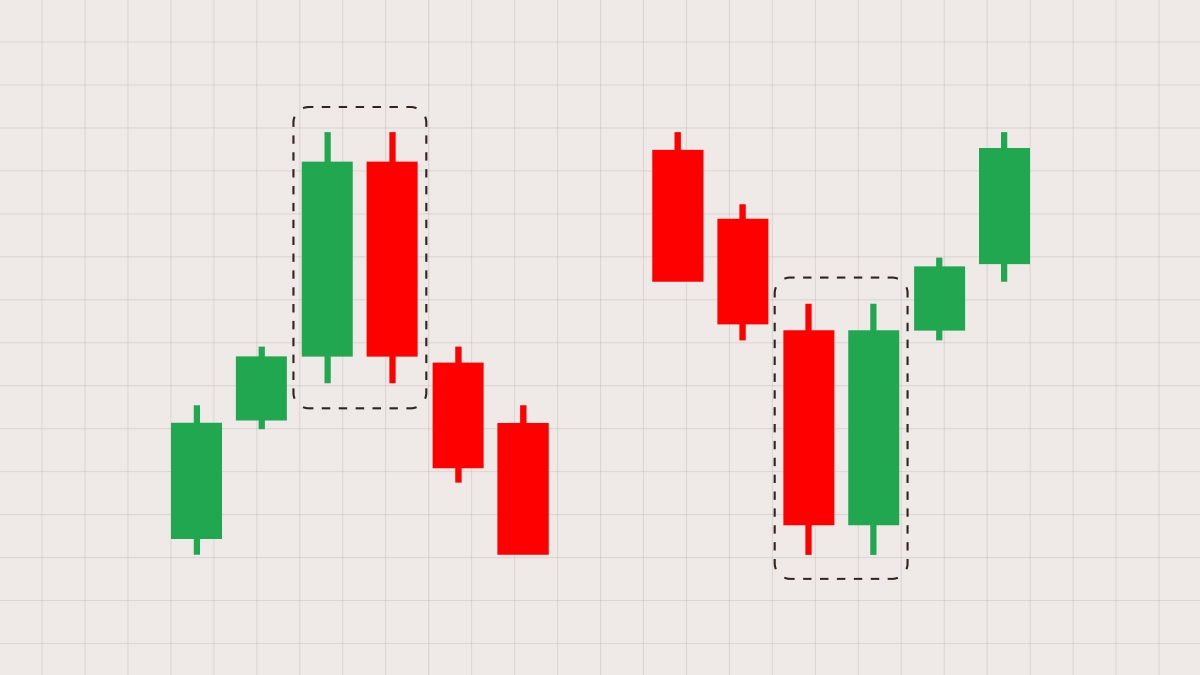
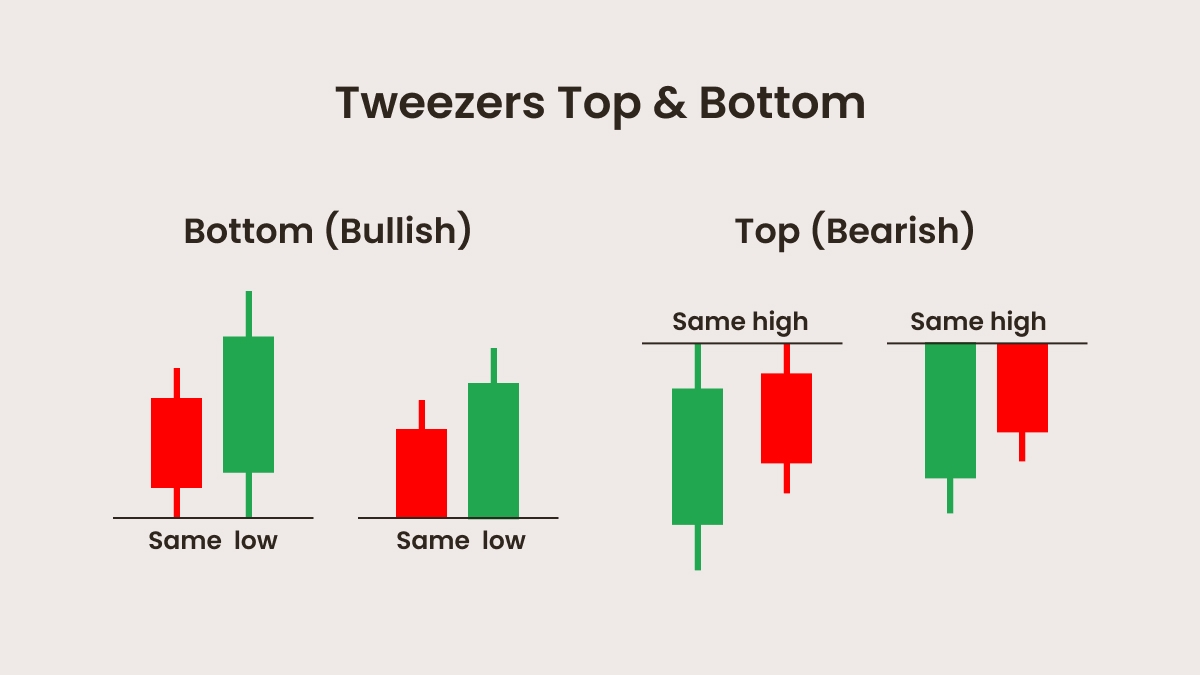
Tweezer patterns form when two consecutive candles print equal, or nearly equal, highs (a Тweezer тop) or lows (a Tweezer Bottom). “Equal” doesn’t have to be an exact match — a small difference of a few pips is acceptable. The similarity can be in the wicks, the open/close levels, or a mix (e.g. the first candle’s high aligns with the second candle’s close). Candle colors also don’t matter; what matters is that there is a shared rejection level.

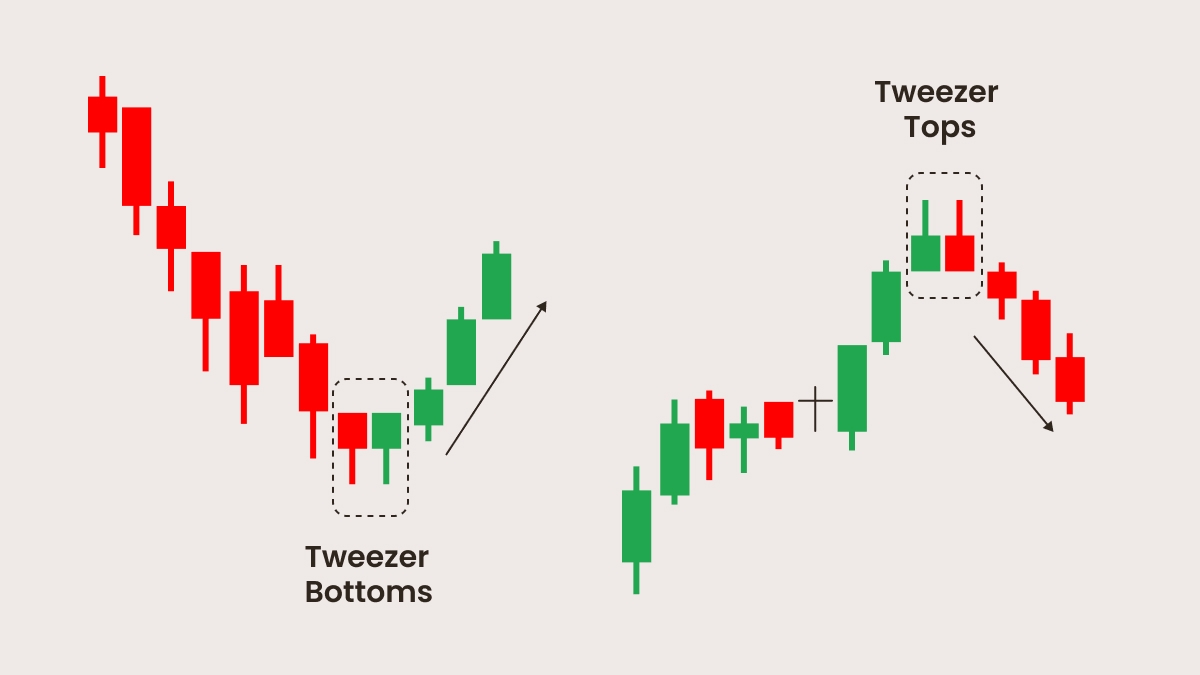
They can appear at the top of an uptrend or the bottom of a downtrend and indicate that the trend is starting to lose steam. The price hits a level, bounces off, and refuses to break through. They don’t mean a reversal is definitely coming, but they’re a strong sign that the price is starting to hesitate. Traders can use other data tools to confirm a reversal.

The difference between Tweezer Tops and Tweezer Bottoms

There are two types of Tweezer candlestick patterns, depending on bullish and bearish momentum. Both are rejection patterns, meaning that the price hits a level, bounces off, and refuses to break through.

A Tweezer Top shows up after an uptrend and suggests the price might fall. The first candle will usually be green (bullish), showing buyers are still in control. The second candle rises to the same previous high — or very close to it — and then rejects lower. The color doesn’t matter; what matters is the failed push at the same level.

When a Tweezer Top is formed, it means that buyers tried to push the price higher again but hit the same resistance as before. They couldn’t break through, and sellers shoved back harder, pushing the price down. The formation suggests that the uptrend might be coming to an end, and if the next candle is also red, that's a stronger warning that the uptrend might be over.

A Tweezer Bottom works in the opposite way. It appears after a downtrend and hints that the price is hitting a support level and will possibly bounce back up. The first candle is therefore red.

The second candle drops to the same previous low — or very close to it — and then rejects higher. The candle color doesn’t matter here. What matters is that both candles share the same support level.

Tweezer Bottoms tell you that the selling pressure is coming to an end. Buyers then take the lead and outnumber sellers, driving the price up. If the next candle is bullish and breaks above the Tweezer range, it’s a pretty good sign that a bullish momentum is starting to take hold.

PatternAppears afterMatching priceSignal
Tweezer TopUptrendHighsBearish reversal
Tweezer BottomDowntrendLowsBullish reversal


The difference between Tweezer Tops and Tweezer Bottoms

Tweezers vs. similar patterns

Tweezers are similar to other patterns. The main difference is that they point to immediate rejection at a key price level, while the other patterns show slower, more deliberate reversals.

Tweezer Top or Bottom

Two candles with nearly the same high or low. It’s a quick sign that the price has hit a wall and is starting to hesitate.

Double Top or Bottom

Takes longer to form. You’ll see two highs or lows with a pullback in between, showing a longer tug-of-war before the market finally turns.

Engulfing Pattern

Also two candles, but the second one completely covers the body of the first. It’s more about a shift in control than about matching highs or lows. One side overpowers the other.

Morning Star or Evening Star

Three candles. The first continues the trend, the second shows indecision, and the third confirms the reversal. The direction change is slower than a Tweezer's.

How to spot a Tweezer candlestick pattern

Spotting a Tweezer pattern is very simple. You don’t need to dig into indicators or draw lines or anything like that. You just look at your chart and find two consecutive candles. Look for two consecutive candles. In a Tweezer Top, the highs are equal or nearly equal, and in a Tweezer Bottom, their lows are equal or nearly equal. The second candle has to reject that level (fail to break through). The candle color is irrelevant. What matters is that they both touch the same price level and reject it.

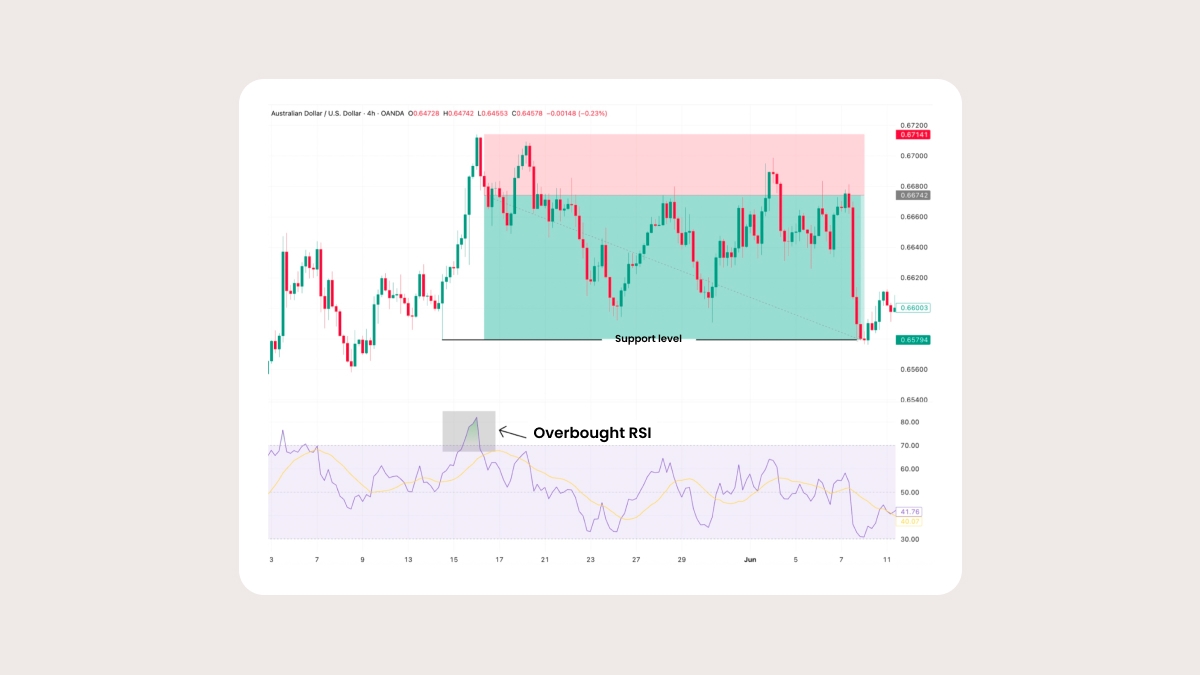
Candlestick charts can be set for different timeframes. On very short timeframes like 1-minute charts, the market moves around a lot due to random activity. This creates a lot of small patterns that don’t really mean anything. A term that traders often use to call this is “noise.” A trend is more likely to be spotted by taking a step back and seeing the bigger picture. Tweezer patterns tend to work better on longer timeframes, such as 4-hour charts, daily charts, and so on, because they’re more likely to reflect what real buyers and sellers are doing and could signal a bigger move.

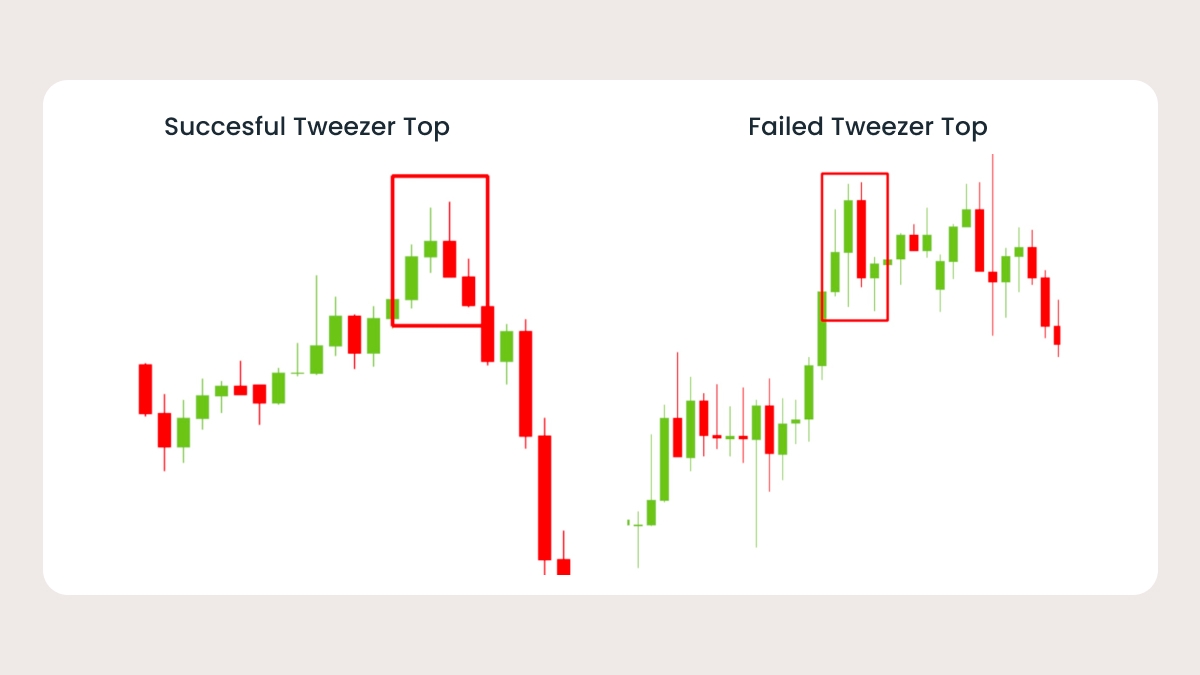
Just because two candles line up at the same high or low doesn’t automatically make it a strong Tweezer, though. The second candle should show some kind of reaction to the first, such as the price reversing or struggling to break through. It has to be a strong signal that control is switching from buyers to sellers or from sellers to buyers.

A Tweezer pattern also doesn’t mean much on its own. It has to show up at a certain time, either during an uptrend or a downtrend, at a clear resistance or support level. If you see it form in the middle of a sideways range where the price is just chopping around, you should most likely ignore it.

Context matters. Tweezers are far more reliable at strong support or resistance levels, near a trendline or Fibonacci level, and on timeframes aligned with the dominant trend.

Using other indicators like the Relative Strength Index (RSI) can help, too. The RSI will show you whether the market is overbought or oversold. If the market is overbought when a Tweezer Top forms, or oversold when a Tweezer Bottom shows up, that can add weight to the case that a reversal will follow. One way to get the hang of spotting worthy Tweezer patterns and trading them is by practicing in a demo account.

How to spot a Tweezer candlestick pattern

Checklist and detection rules

You can use this quick checklist before trading on a Tweezer pattern to filter out weak setups.

1. Candle match

Two candles appear back to back with equal or nearly equal highs or lows. The second candle rejects the level in the opposite direction.

2. Trend context

Tweezer Tops form after uptrends, Tweezer Bottoms after downtrends. Ignore Tweezers in sideways markets.

3. Key levels

The pattern should appear near support, resistance, or Fibonacci zones, not in the middle of a range.

4. Candle quality

Both candles should have clear wicks touching the same high or low, showing price rejection, and the second candle should close strongly in the opposite direction to confirm who’s now in control.

5. Confirmation

Wait for the next candle to close beyond the pattern. Extra signals from RSI, MACD, or volume strengthen the setup.

Entry strategies for Tweezer candlestick patterns

Trading Tweezer patterns is relatively simple, but the more indicators you use to back up your assertion, the greater the probability you have of placing a successful trade.

First, identify a clear trend upwards or downwards, and disregard tweezers that form when the market is just moving sideways.

After you see a Tweezer Top or Bottom forming during a trend, don’t jump in right away. Wait for the next candle to form — that will be your confirmation. For a Tweezer Top, the confirmation will look like a candle that drops below the pattern. For a Tweezer Bottom, the candle would push above it.

Once that confirmation candle appears, you have your signal to enter the trade. You then have two options, depending on whether it’s a Tweezer Top or Bottom.

If it’s a Tweezer Top and you think the reversal is coming, you can enter a short position in the hopes of making money as the price drops, and place a stop-loss just above the pattern's high in case the price breaks through. For a Tweezer Bottom, you can buy in, hoping to make money on the way back up by selling it for more than you bought it for. You can set a stop-loss just below the low in case the price breaks lower.

To close your position and take profit, you can set a limit at a recent support or resistance level or sell it whenever you feel comfortable. Using tools like the RSI and the order book can help you identify clear and logical price targets to close your position.

Confirmation & invalidation

Confirmation

A Tweezer is confirmed only when the next candle moves in the same direction as the expected reversal.

  • In a Tweezer Top, you need the next candle to close below the pattern’s low. That shows sellers are stepping in and pushing the price down.

  • In a Tweezer Bottom, the confirmation comes when the next candle closes above the pattern’s high, meaning buyers are gaining control.

When that confirming candle has a strong body, higher volume, or is backed by signals like RSI divergence, the setup becomes more trustworthy.

Invalidation

A Tweezer pattern fails when a price breaks past its limit.

  • A Tweezer Top fails if the next candle makes a new high right after the pattern forms.

  • A Tweezer Bottom fails if the next candle drops to a new low.

Once that happens, the market’s telling you the reversal didn’t stick. The trend is still alive and may keep going.

Failed Tweezers

If a Tweezer fails, don’t ignore it. It often reveals where the real momentum is. That new high or low can guide where to place your stop-loss so you’re protected if the trend continues. Some traders even switch direction and trade the breakout, since a failed Tweezer Top often marks the moment the market regains strength, while a failed Tweezer Bottom means the downtrend is continuing.

Common mistakes to avoid

Context matters a lot when it comes to trading Tweezer patterns, so it’s important to take a step back and look at the bigger picture before placing your trade. This can help you avoid succumbing to trading noise or making other mistakes.

A common mistake traders make when trading Tweezers is selling or buying too early, as soon as they see the Tweezers form. Waiting for the confirmation candle increases your chances of trading logical signals rather than noise, making it less of a guessing game. Take your time, prices tend to react more around important support and resistance levels, so a Tweezer pattern that forms around those levels after a long rally will more likely be followed by a reversal than one that forms in the middle of nowhere.

Unless there are really solid reasons to do so, trading on a Tweezer pattern against the trend is generally a mistake. If the overall trend is strong, then a small reversal pattern might not hold, and the market can just keep going in the same direction after a little pause.

Trading without a stop-loss can also lead to bigger losses. Nothing is certain when it comes to trading, so even if the Tweezer pattern setup looks perfect and you find confirmation from other indicators, things can go wrong. Using a stop-loss can therefore protect your account in the event that things don’t turn out as expected by automatically pulling you out of the trade after a certain level to avoid further losses.

It’s also OK to just walk away from a trade, even if you’ve spent time on it. Sometimes a trader will want to open a position because they will feel like they wasted their time planning for the trade if they don’t. This can be a mistake when they haven’t had enough confirmation, or when they were correct, but took too long to enter the trade. Timing is important, so it’s better to abort and miss a trade altogether than to rush in too late after the opportunity has passed, or get caught in a fake-out and watch your balance plummet. The goal isn’t to trade every signal, but to trade the right ones at the right time.

Tweezer outcomes in practice

Not every Tweezer signals a clean reversal. Some work perfectly, but others fail and become continuations. Below are two examples:

  • Successful Tweezer Top: The price rallies into resistance and forms two equal highs. The second candle rejects lower, and the third provides confirmation with a bearish close.

  • Failed Tweezer Top: Two equal highs are formed, but instead of dropping, the next candle breaks higher, invalidating the pattern and showing buyers still in control.

The same logic applies to Tweezer Bottoms: a valid setup needs confirmation with a bullish close, while a break to fresh lows invalidates the pattern and signals continuation.

Tweezer outcomes in practice

Tweezer Top example

Tweezer pattern example

Let’s look at an example. You are watching candles on the 4-hour AUD/USD chart. The price has been rallying. Suddenly, two candles pop up with the exact same high. The first one is bullish. The second opens at the same high, then turns bearish and closes lower.

Your Tweezer pattern has formed, so you now check for confirmation. The RSI is over 70, which means the pair is overbought. This is a good sign because it supports the case for a reversal.

The next candle opens and drops past the lows of both candles. This is your entry point for a short position. You set a stop-loss just in case, just above the highs of the last Tweezer candles. You can then set a limit to exit this short-term trade at the next support level. If the price had instead made a new high right after the Tweezer pattern, the setup would be invalid. That’s why you should place your stops beyond the pattern’s highest or lowest point.

Tweezer Bottom example

Tweezer Bottom example

On this 30-minute EURUSD chart, the price has been falling steadily. Then, two candles print with almost identical lows (see upper red box). The first is bearish, pushing into support, and the second is bullish after failing to break lower.

This Tweezer Bottom is formed at a key level. We can see that the RSI is near oversold territory (see bottom red box), which supports the idea of a potential reversal.

The next candle confirms the setup by breaking above the Tweezer range. That’s your signal to open a long position. A stop-loss is placed just below the shared lows to manage risk, while the take-profit is set near the next resistance level.

Share with friends:

FBS at social media

iconhover iconiconhover iconiconhover iconiconhover icon

Contact us

iconhover iconiconhover iconiconhover iconiconhover icon
store iconstore icon
Get on the
Google Play
store iconstore icon
Get MT4 on the
App Store
store iconstore icon
Get MT5 on the
App Store

Trading

Company

About FBS

Our social impact

Legal documents

Company news

FC Leicester City

Help Center

Partnership programs